NMR Infographics
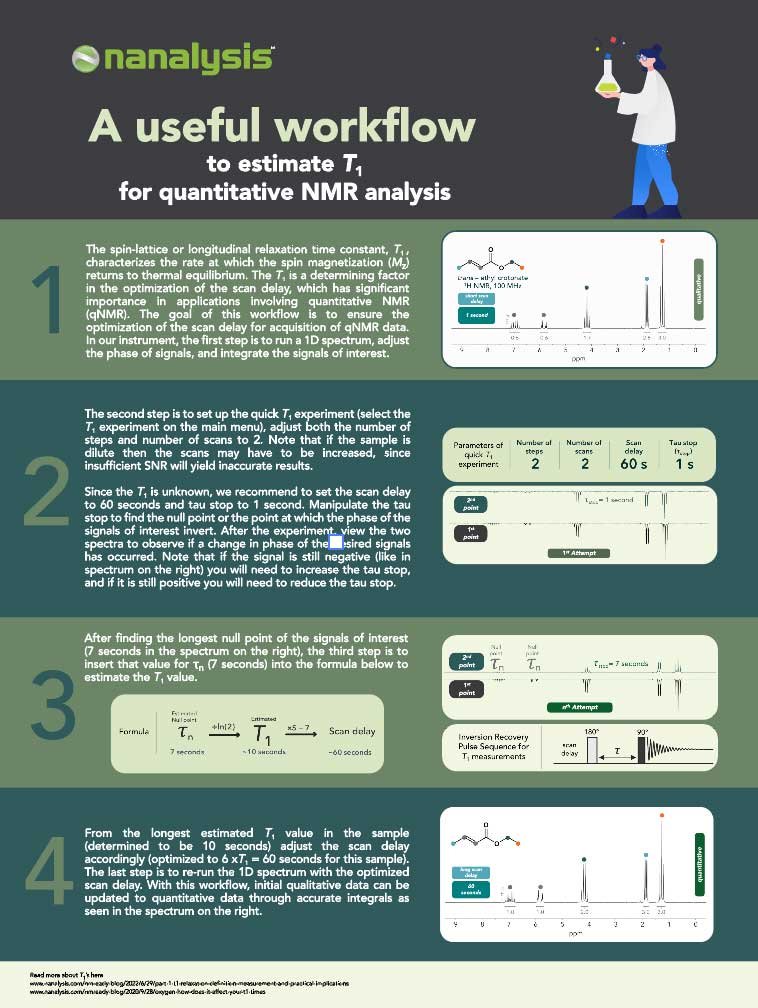
A useful workflow to estimate T1 for quantitative NMR analysis
Determining isotopic ratio by benchtop NMR: 10B vs 11B

Coupling constant, chemical shift,
and peak dispersion.
How does NMR field strength affect them?
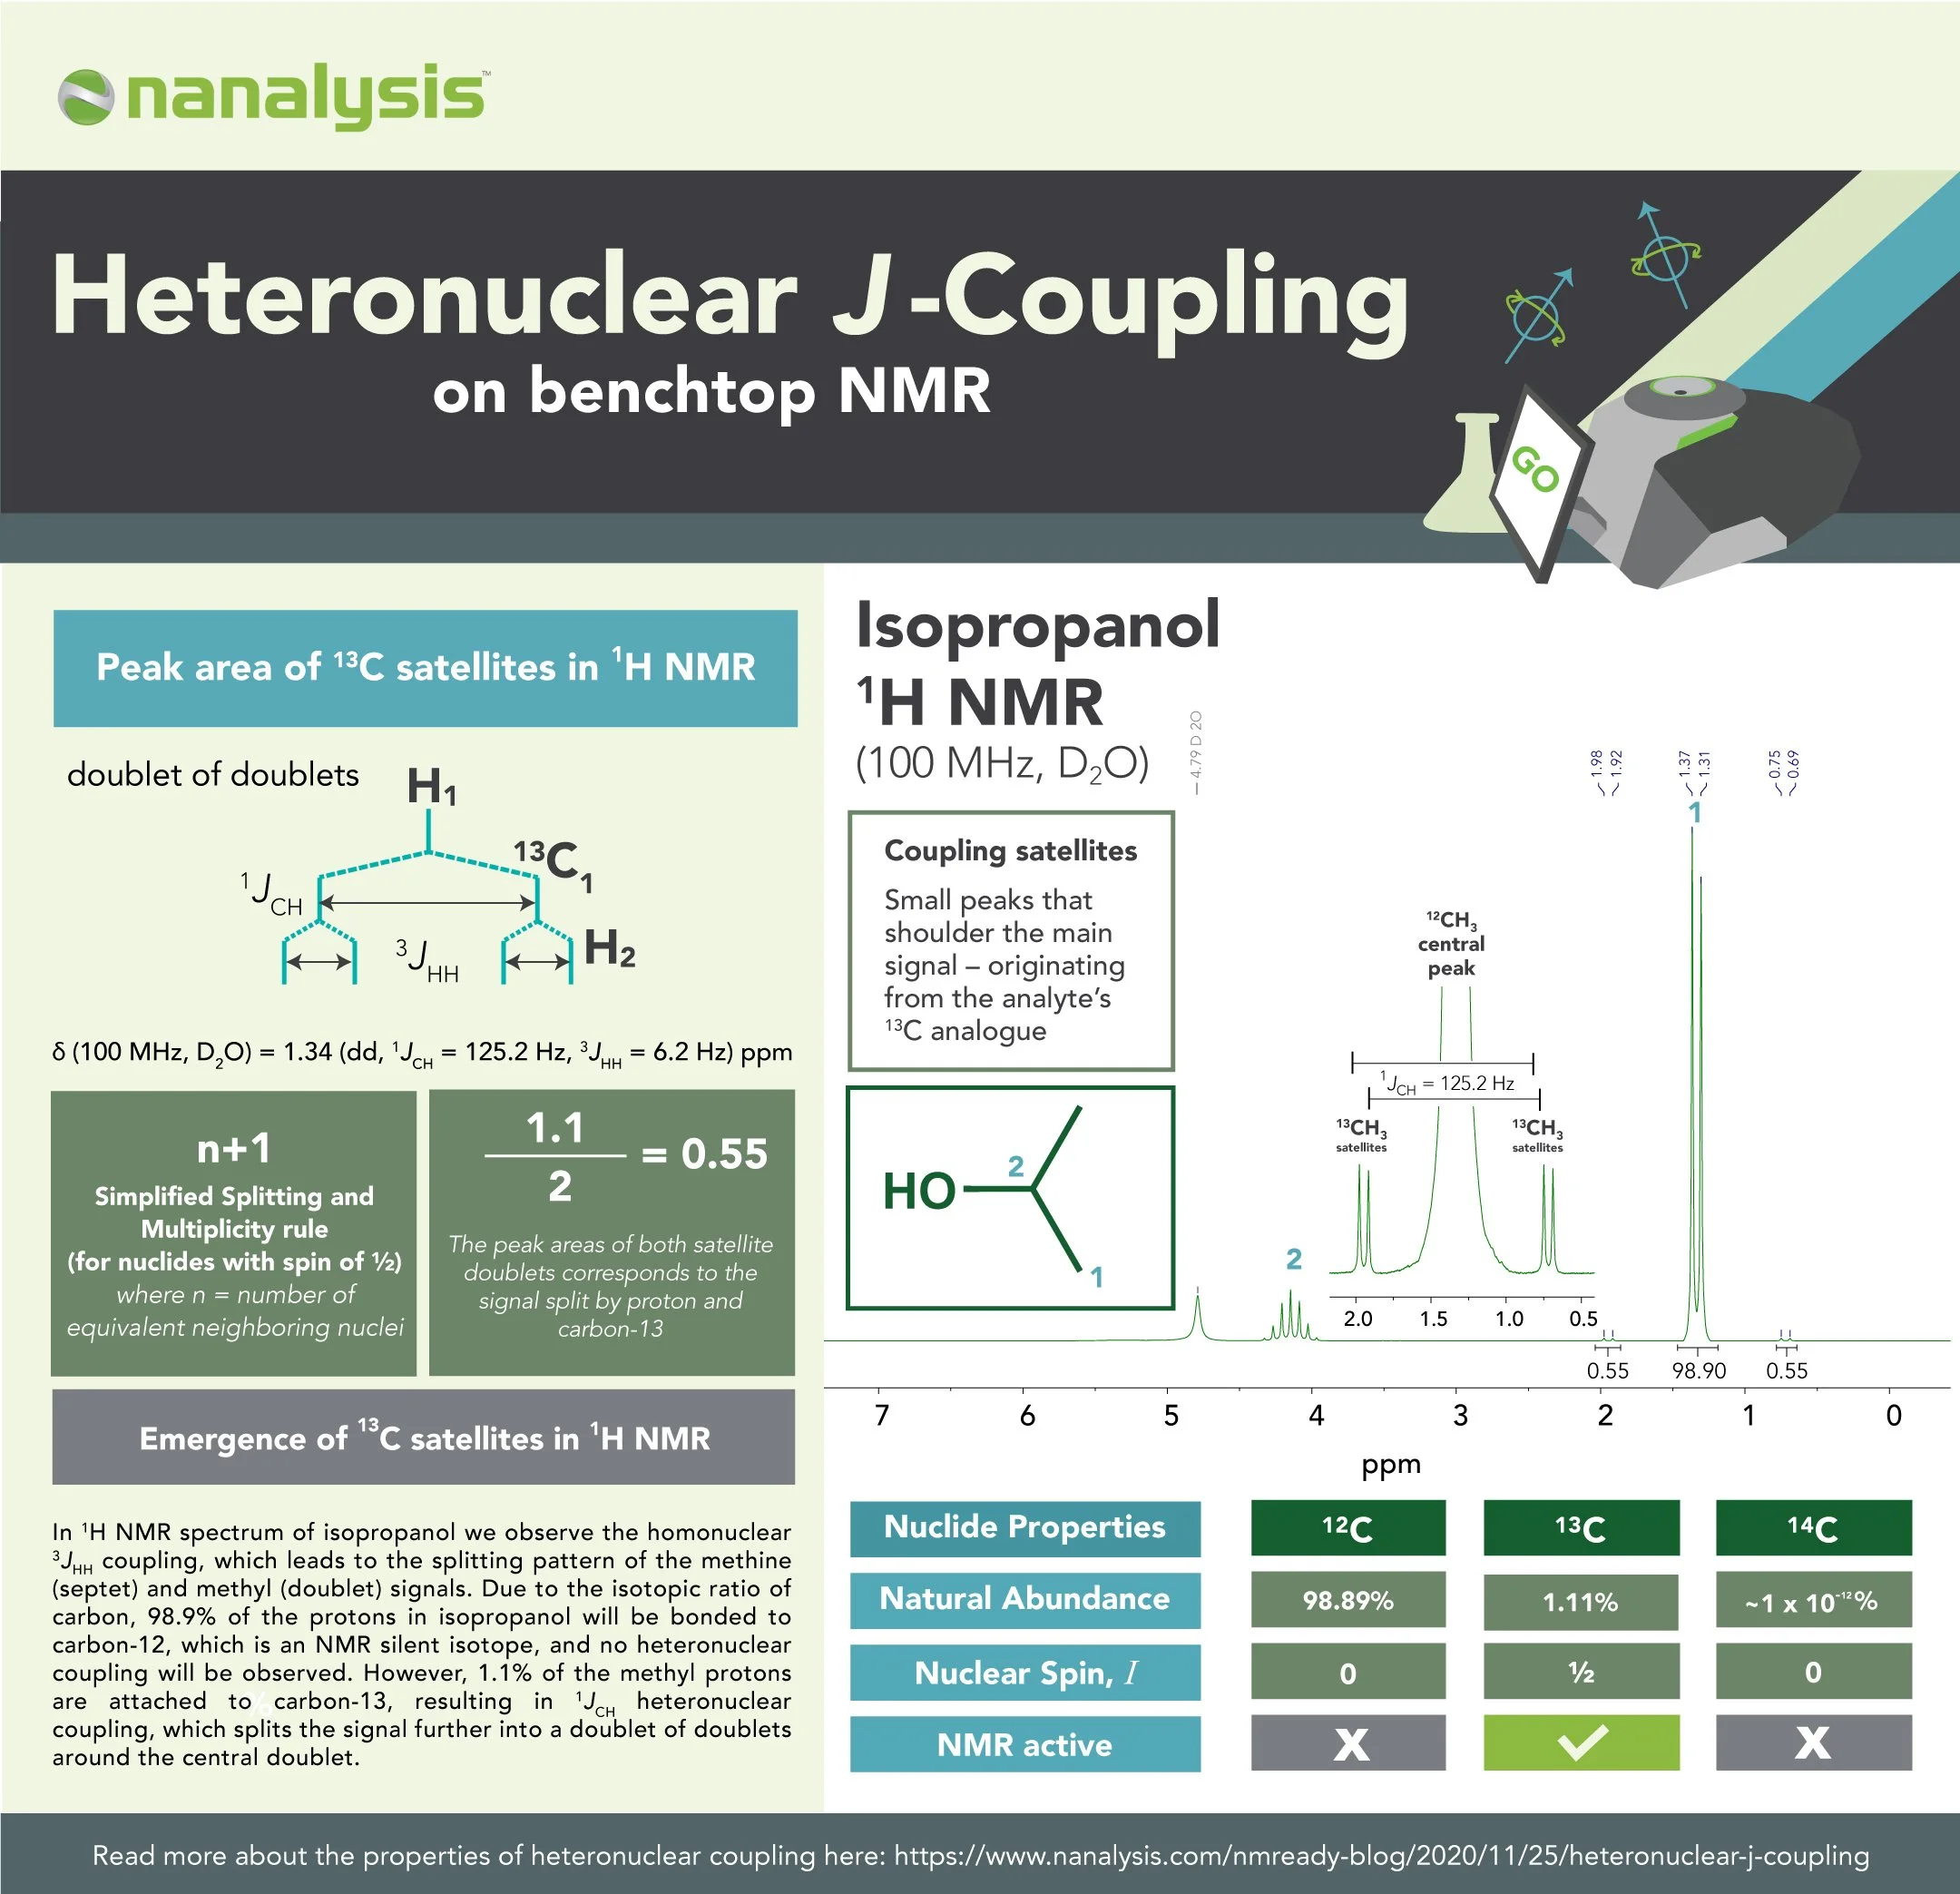
Heteronuclear J-Coupling on
Benchtop NMR
Delve into some of the interesting properties of heteronuclear J-coupling with this infographic. We cover the fundamentals of the communication of nuclear spins between different nuclei in #benchtopNMR spectroscopy.
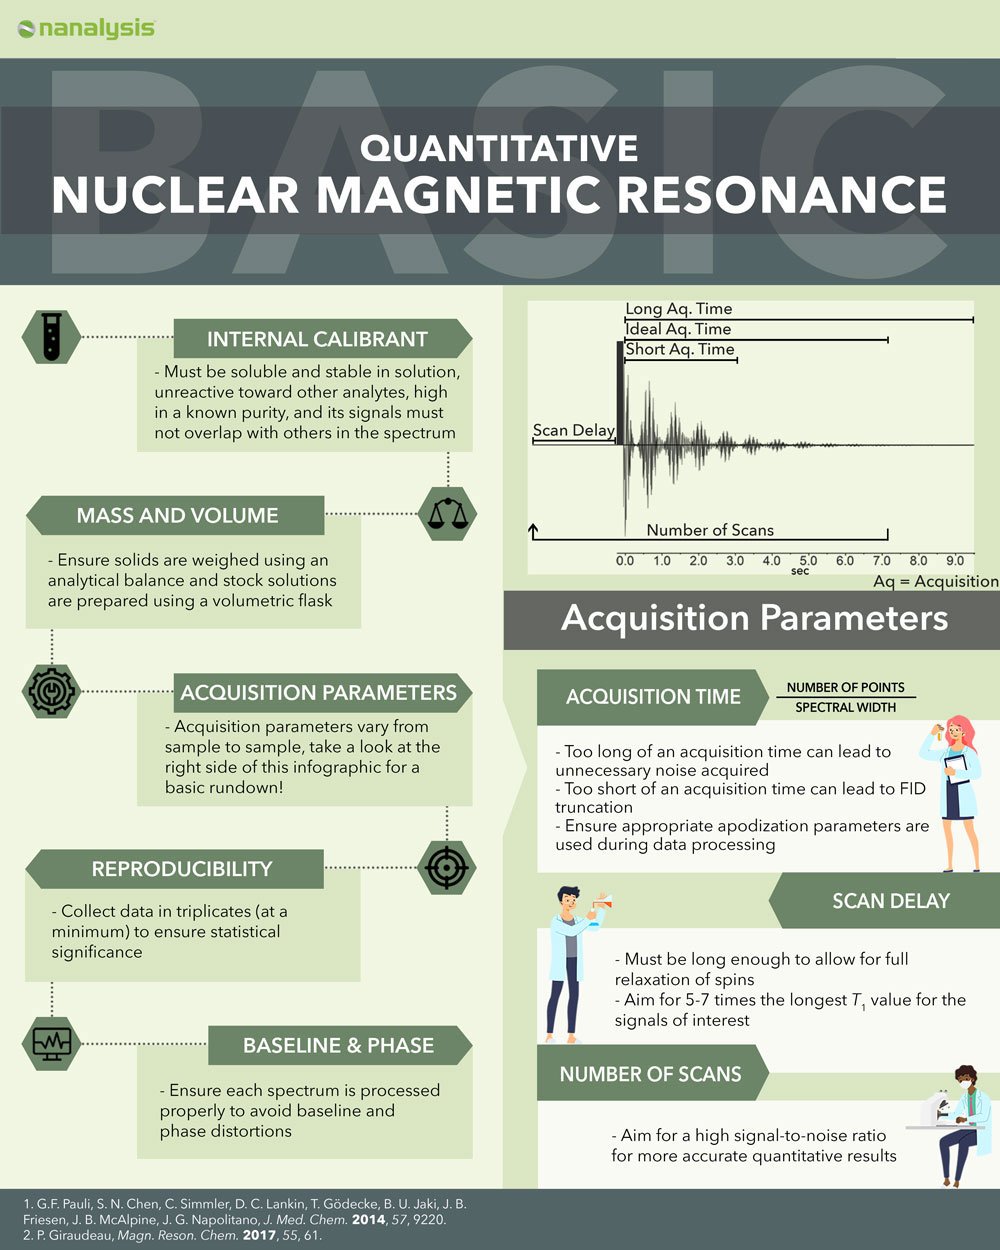
Quantitative Nuclear Magnetic Resonance
What’s the difference between acquiring a spectrum
and obtaining analytical quantitative results?
Learn more about key parameters in qNMR in this infographic.

Decoupling Modes on Benchtop NMR
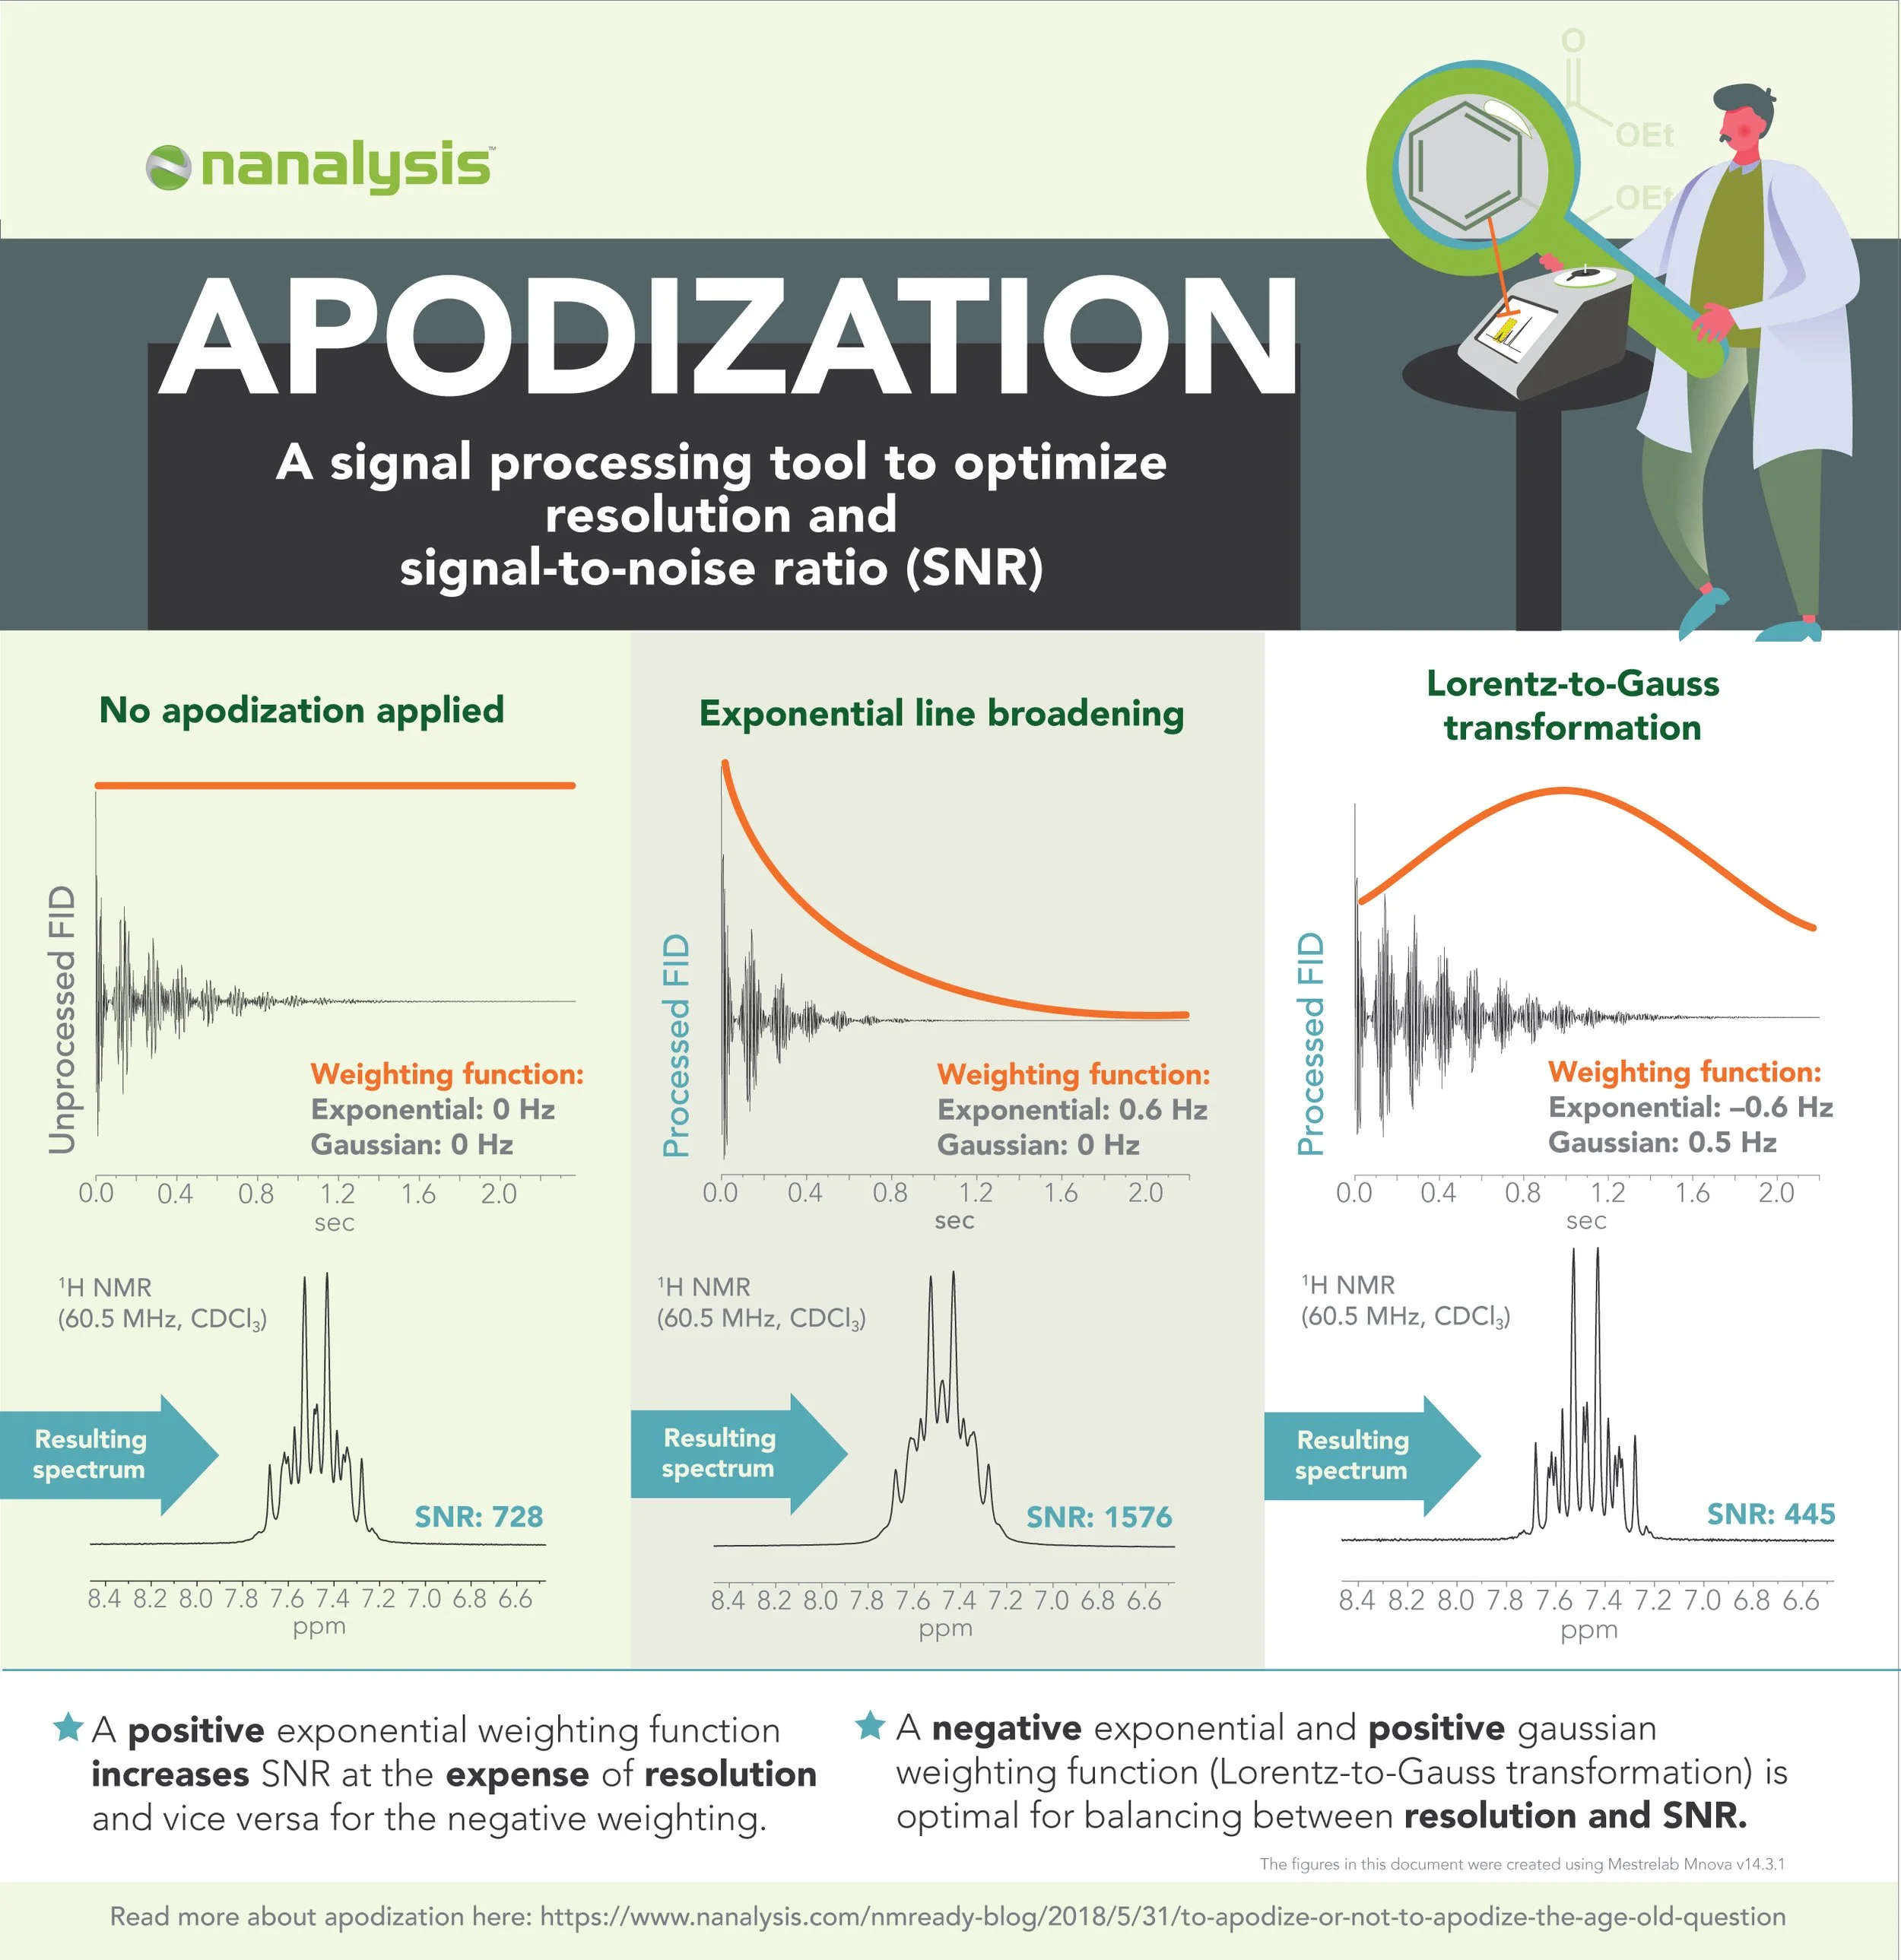
Apodization Processing Tool
Enhance SNR
There are many standard ways to post process NMR data. Learn more about how apodization can be used to optimize your visual output!

DEPT-45/-90/-135 & APT Experiments
Easy assignment of your carbon spectrum with DEPT experiments. This infographics simplifies the output to streamline your assignment!
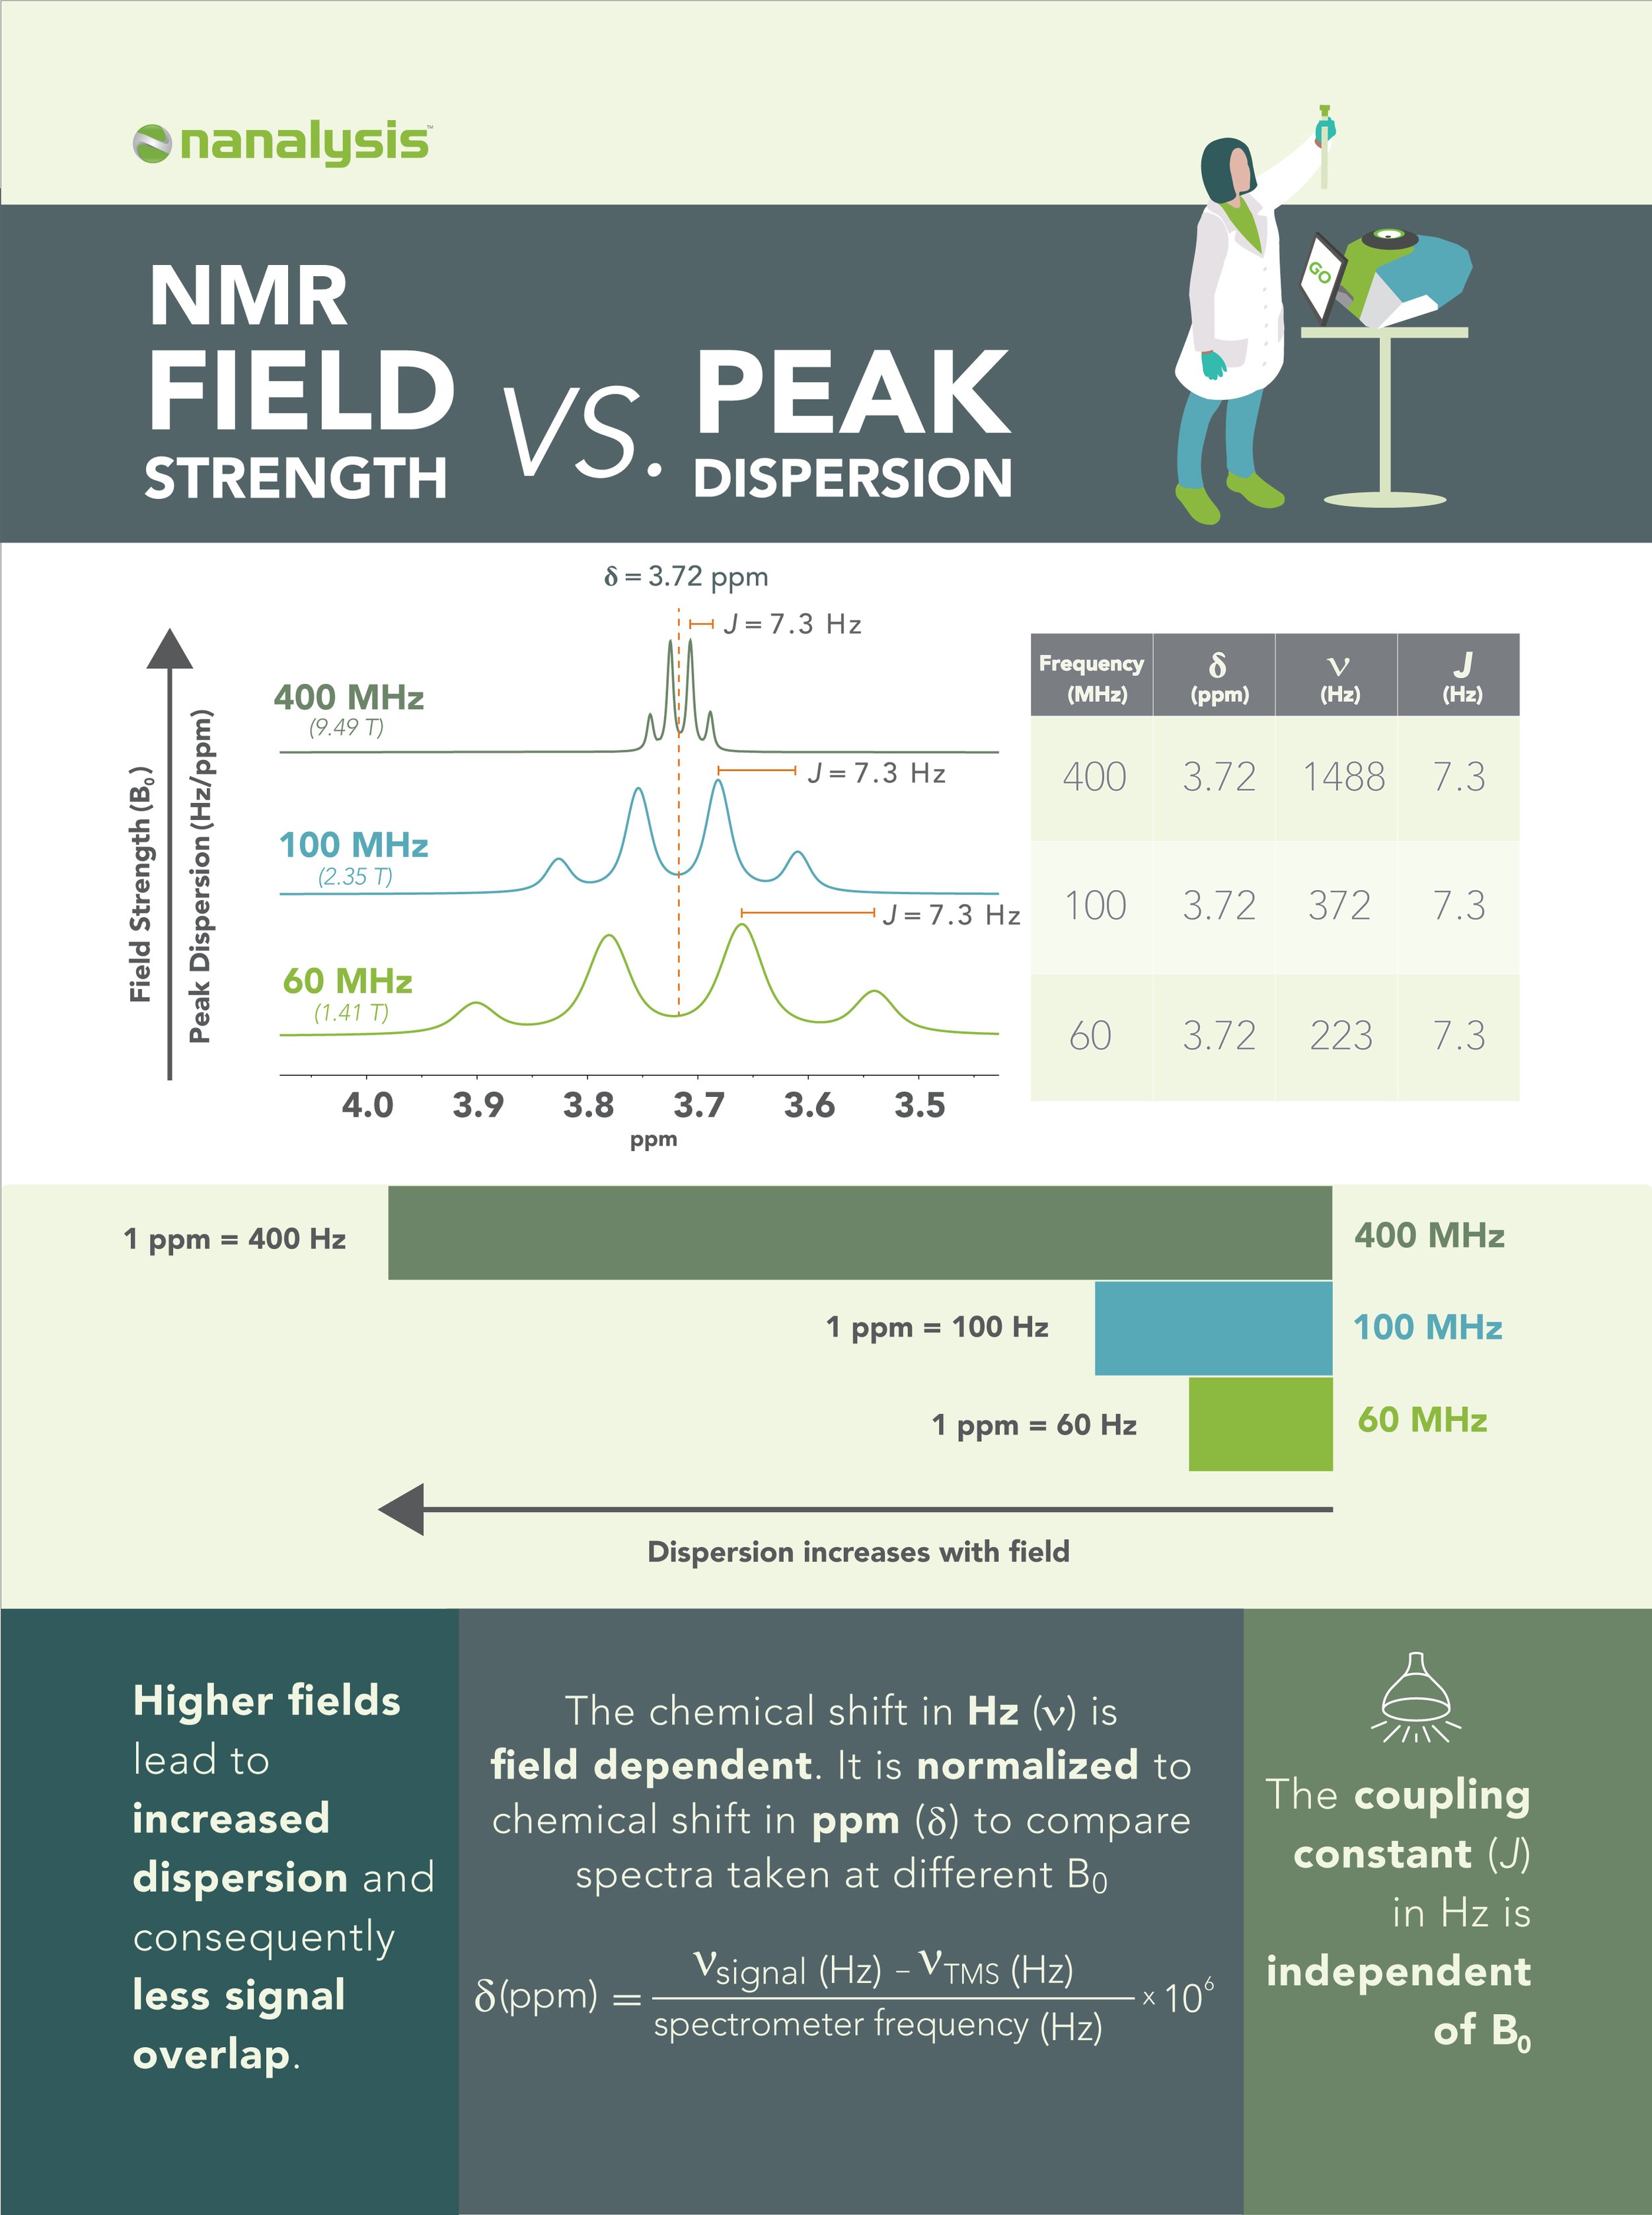
NMR Field Strength vs. Peak Dispersion
Low-field vs. high-field NMR how field strength can change visually change your NMR Spectrum.