To apodize or not to apodize - the age old question
Are you familiar with the apodization tool in Mnova? Apodization (also referred to as Weighting or Windowing) literally translates to ‘cutting off the feet’ from the original Greek. In this case, the ‘feet’ are the leakage or wiggles that appears when the NMR signal rapidly decays to zero. As such, apodization can enhance the resolution or the sensitivity (S/N ratio) in the spectrum and even remove truncation artifacts after data has been collected. This function is particularly useful for spectra acquired on a benchtop NMR instrument due to the lower S/N ratio compared to spectra collected on high-field instruments. In Mnova, it is possible to choose among several window functions which can be applied simultaneously. The tool is accessed by clicking on the apodization button found within the Processing ribbon (or by using the keyboard shortcut, W).
When I’m processing NMR data I primarily use the Exponential and Gaussian functions. Applying a positive Exponential function will increase the sensitivity of the spectrum at the expense of the resolution.
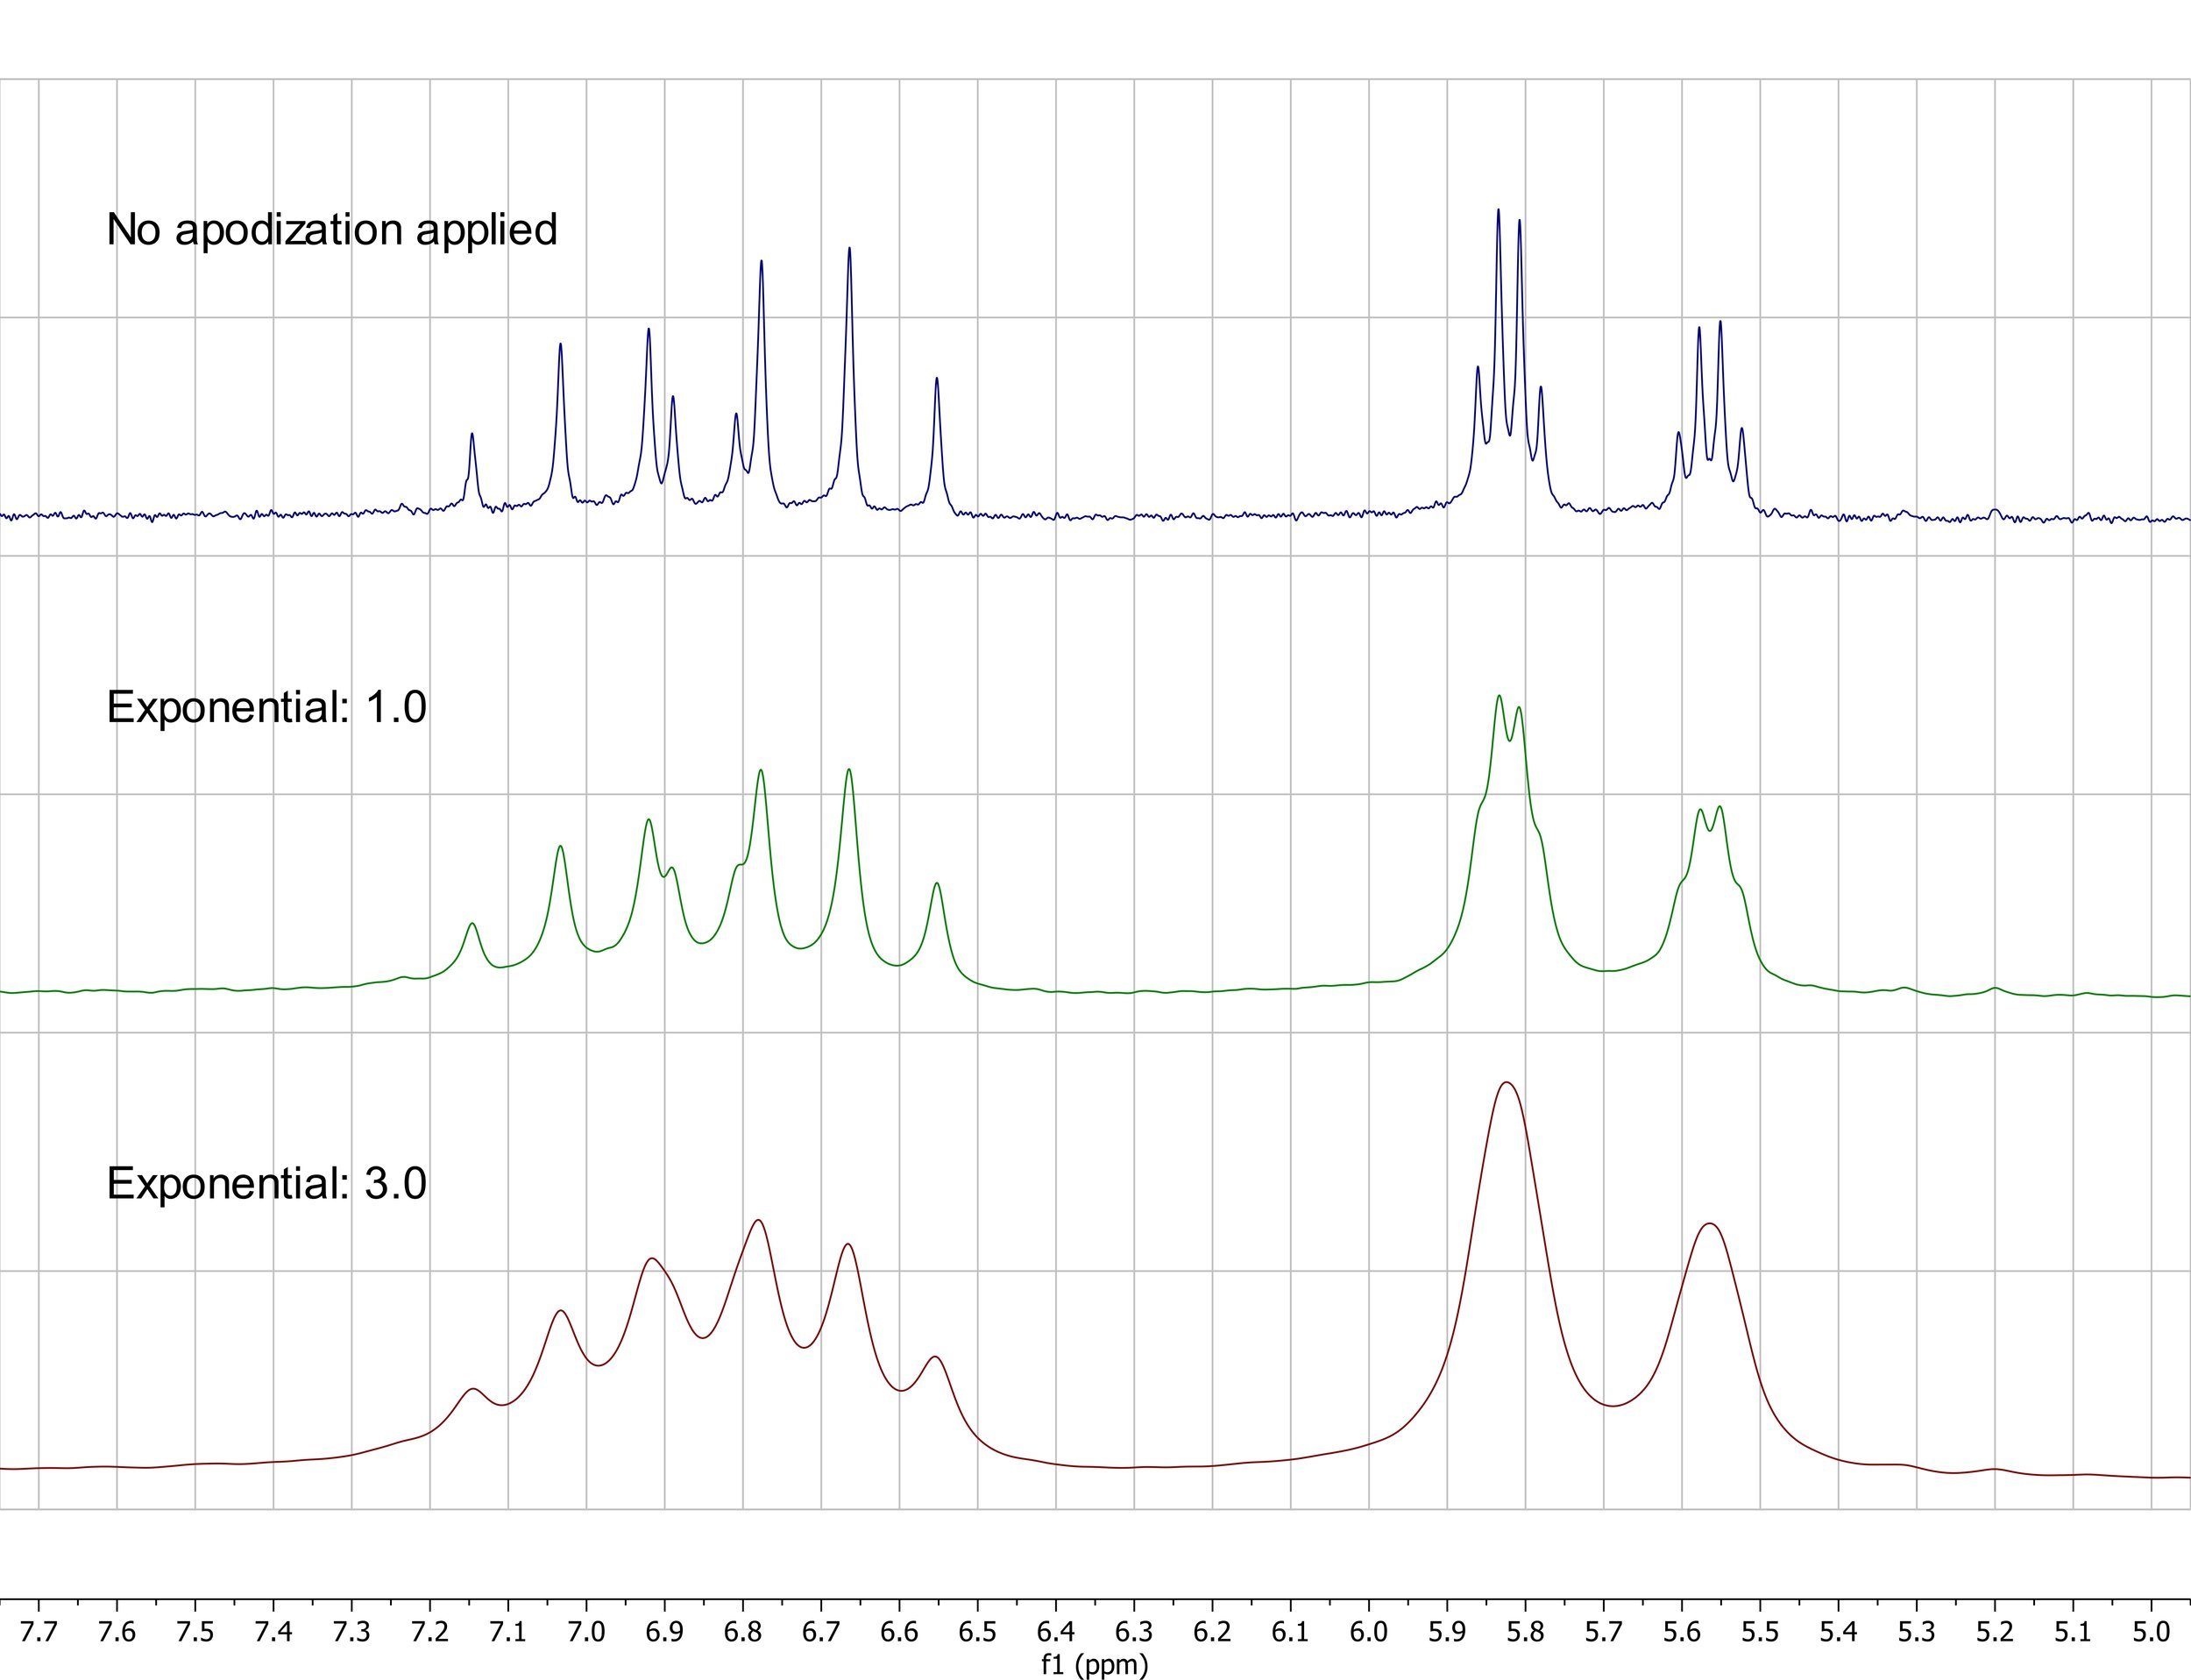
Figure 1
If a negative Exponential function is applied, the opposite effect is obtained with increased resolution and a decrease in sensitivity.

Figure 2
While similar to the Exponential function, the Gaussian function results in less line broadening compared to the Exponential function.

Figure 3
Typically, I get the best results when I apply the Exponential and Gaussian functions together. This is also known as the Lorentz-to-Gauss transformation. By introducing a negative value for the Exponential function and a positive value for the Gaussian function, the spectrum can be optimized by adjusting the two parameters.

Figure 4
As you can see, application of the Exponential and Gaussian functions results in an improved spectrum with higher resolution and nearly identical S/N ratio.
Please note that apodization is a great tool for qualitative purposes, but it might be detrimental for quantitative applications (qNMR).1 This will be addressed in more detail in a future blog.
If you have more questions, please don't hesitate to contact us!
1. a) Khirich, G. Anal. Chem. 2021 , 93, 10039-10047; b) Ebel, A.; Dreher, W.; Leibfritz, D. J. Magn. Reson. 2006, 182, 330.