Benchtop NMR Data and Quantum Mechanical Spectral Analysis
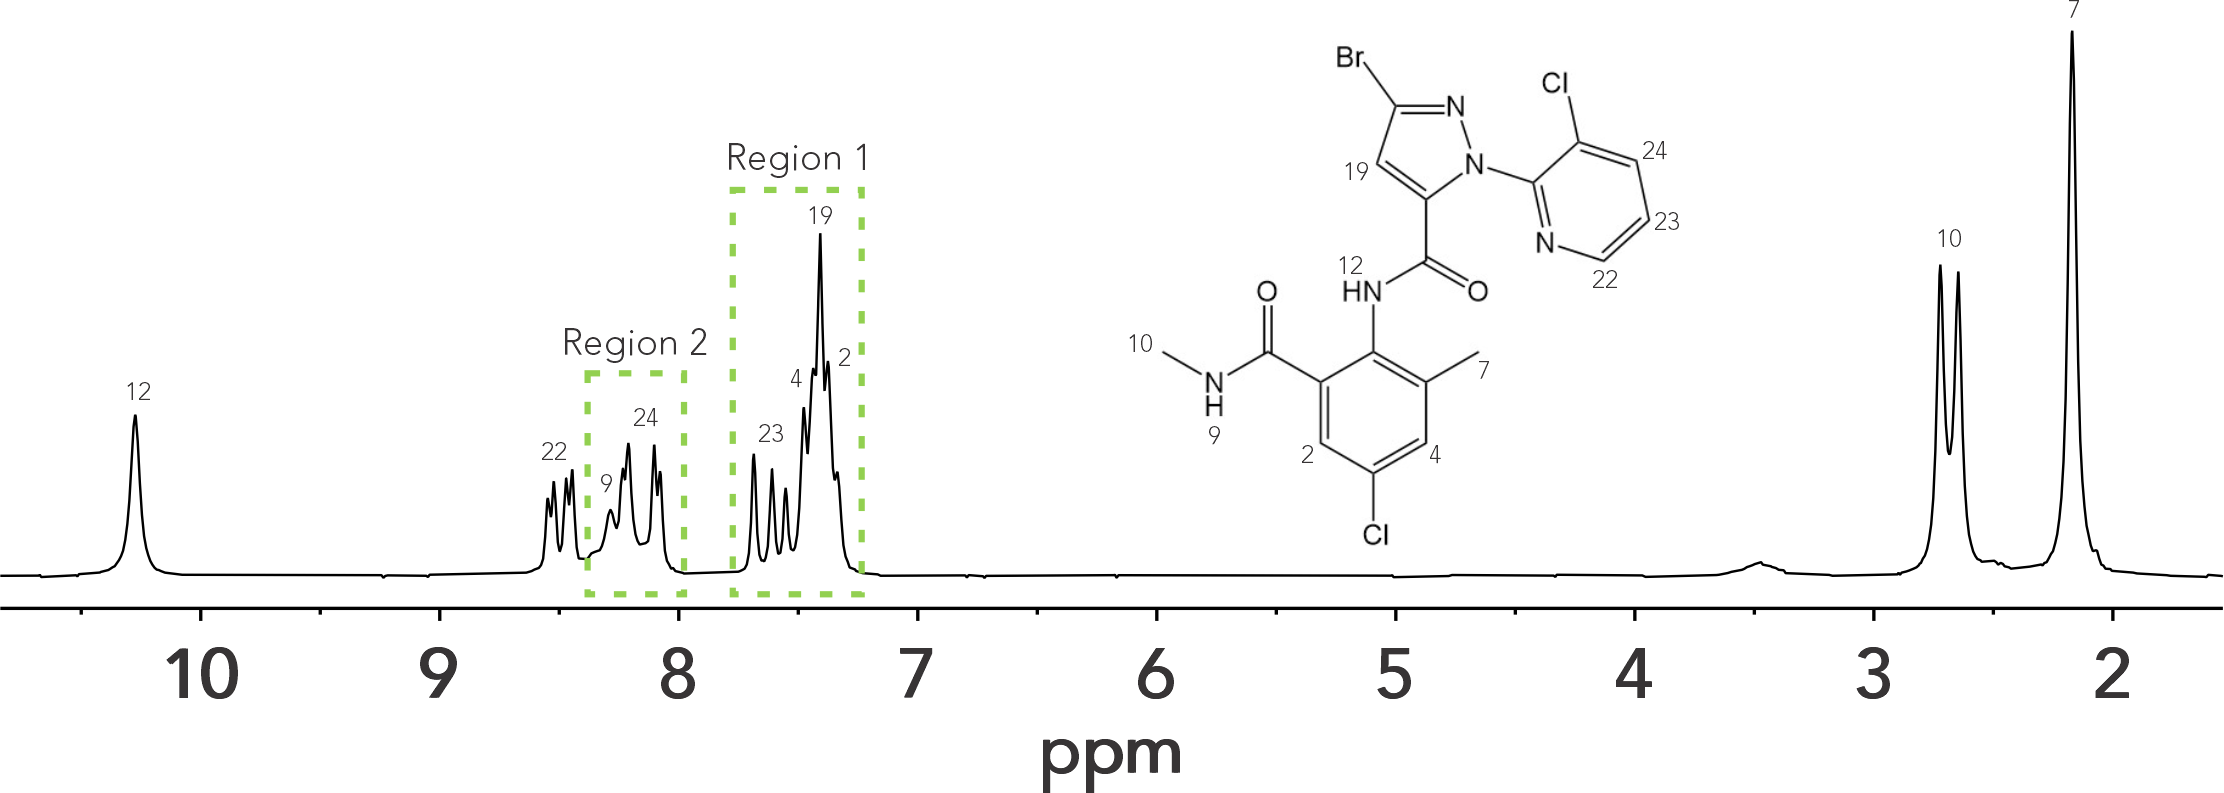
It is well known that signal dispersion decreases as the NMR field strength is reduced. For example, at 400 MHz, 1 ppm spans 400 Hz while at 60 MHz, 1 ppm spans 60 Hz. The main implication is that signal overlap and 2nd order effects are more prone in lower fields, and the spectrum can easily become more complex. We recently published a paper that compiled an extensive list of small molecules that can easily be evaluated using a 60 MHz spectrometer because they only give rise to first-order spectra.1 This list could be extended by combining benchtop NMR data with quantum mechanical spectral analysis. Here we are going to highlight how quantum mechanical analysis can be used in conjunction with a 60 MHz benchtop NMR spectrum to extract NMR parameters from chlorantraniliprole, a human-made insecticide used to control mainly moth and butterfly caterpillars. The 1H NMR spectrum of chlorantraniliprole displayed in Figure 1 shows region 1 (7.22 – 7.75 ppm) where overlapping and 2nd order effects are present and region 2 (8.00 to 8.04 ppm) where two signals overlap (H9 and H24). Overlapping and 2nd order effects prevent the accurate determination of the chemical shift (𝛿), coupling constant (J), and integrals.
We used the software Cosmic Truth (CT)2 to demonstrate the power of quantum mechanical spectral analysis. It performs a 1H iterative full spin analysis (HiFSA)3 providing a way to characterize all the essential NMR spin parameters fully and accurately (𝛿, J, ω1/2 (linewidth at 50%)) for any particular compound, even in the presence of strong overlap and higher-order effects. In addition, CT can be used to confirm structure assignment and perform accurate quantification. CT requires as input a 1H NMR spectrum and the expected chemical structures to perform the iterations. The NMR parameters, the calculated spectrum, the population %, and a score pentagon will be displayed as output (Figure 2).
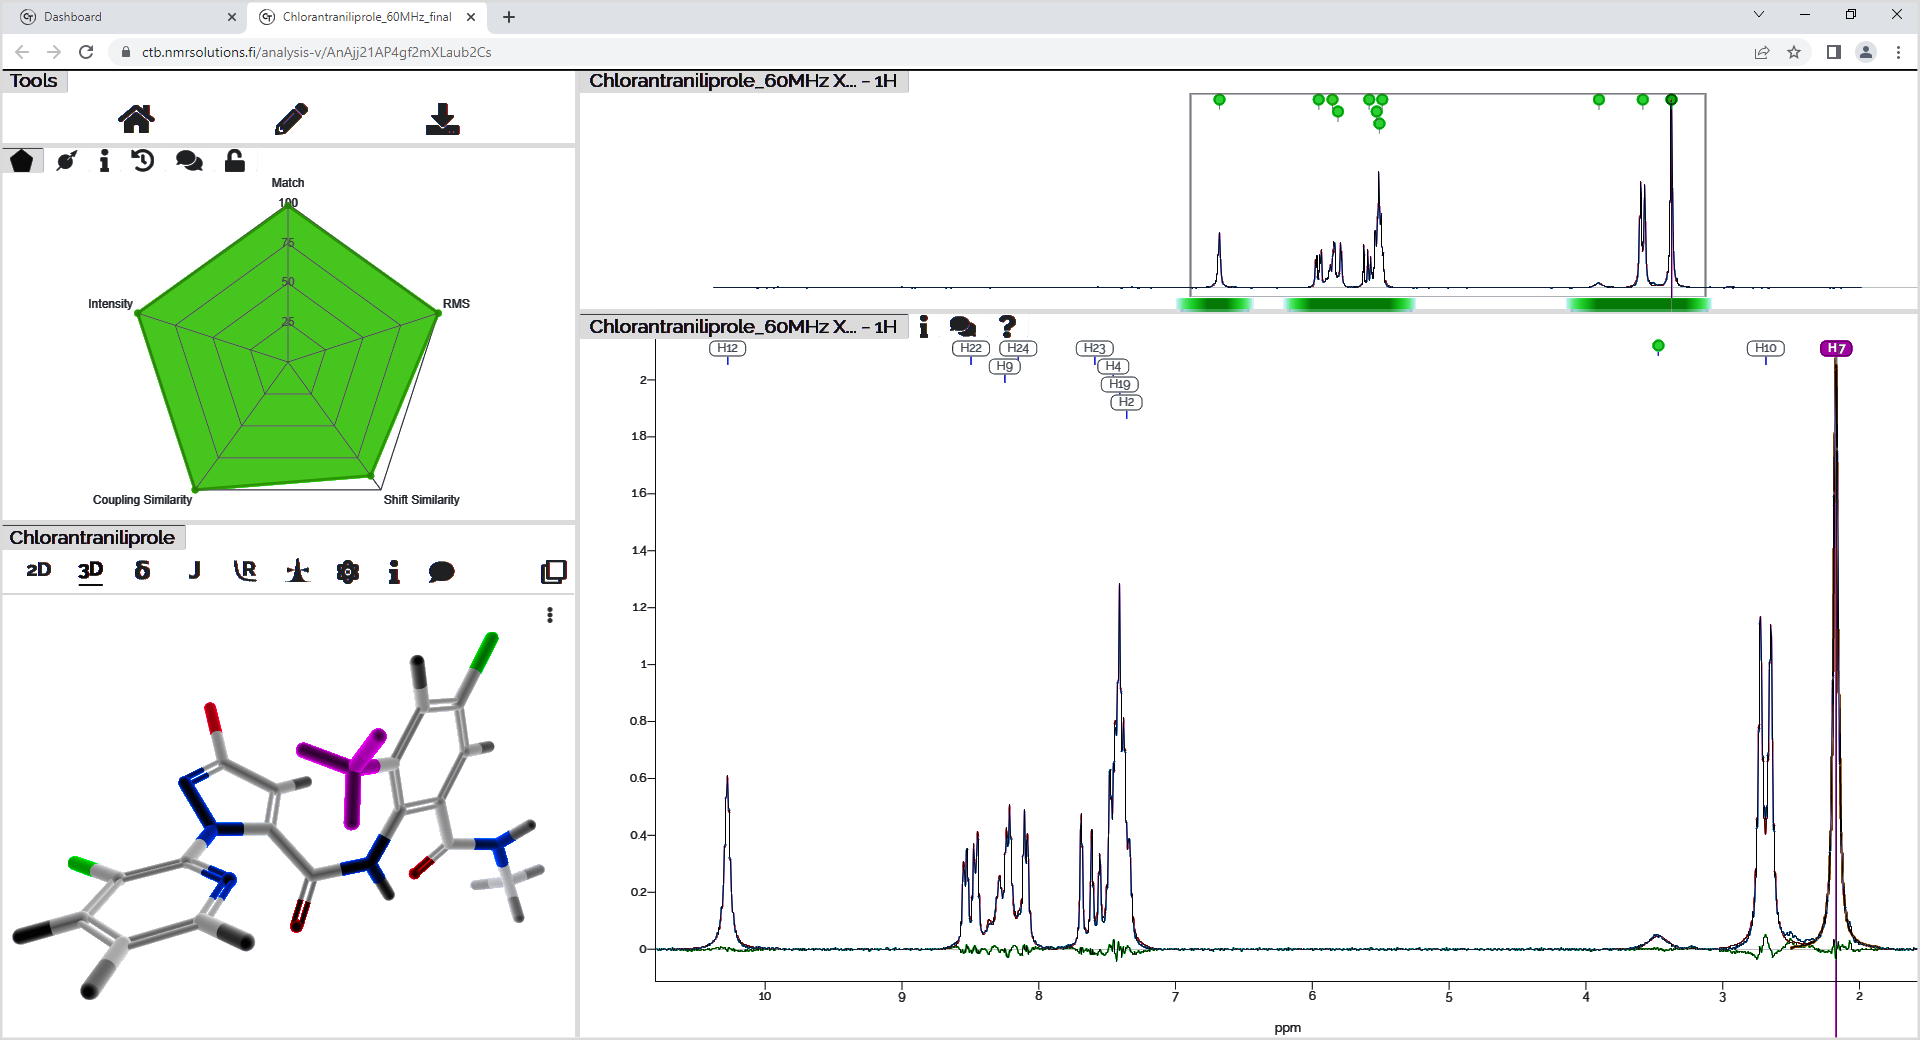
Figure 2: Chlorantraniliprole data analysis output obtained in the software Cosmic Truth.
It is important to mention that CT analysis requires reasonable NMR data to start, it may be necessary to provide a high-field spectrum, or in the case of a complex mixture, the spectrum of each compound. With these data, the main NMR spin parameters can be determined with confidence and this information is used as a model to fit more complex NMR data (low-field spectrum or complex mixtures). In the case of chlorantraniliprole, a 100 MHz spectrum was good enough as a starting point.
This approach becomes especially attractive when a structure verification, identification, or quantification is performed routinely, as it requires high-field NMR data only once to build the model and then a benchtop NMR can be used as a routine analyzer.
Benchtop NMR together with quantum mechanical spectral analysis might be the solution to incorporate routine NMR analysis into your process, even to evaluate a highly overlapped NMR spectrum, being benchtop NMR more accessible and affordable than high-field spectrometers.
1 Araneda J. F., Barbosa T. M., Hui P., Leclerc M. C., Ma J., Maier A. F. G., Riegel S. D., J. Chem. Educ. 2021, 98, 1227-1232.
2 Cosmic Truth: sign up at https://ct.nmrsolutions.io/ (accessed August 08, 2022)
3 Napolitano J. G., Lankin D., McAlpine J. B., Niemitz M., Korhonen S. P., Chen S. N., Pauli G. F., J. Org. Chem. 2013, 78, 2827-2839.