Spicing Up Your Holidays with NMR
If there is one thing that I could say describes the holiday season best, it would have to be the delicious treats I get to indulge in, such as: gingerbread cookies, pies, peppermint bark, and so many more. Wafting in the aroma of baked goods always gives me butterflies in my stomach and lights up my nuclear magnetic resonance (NMR) mind.
This Christmas season, I would like to present you with some 1H NMR analysis of some spices that have traditionally defined the season for many people. These spices are nutmeg, ginger, allspice, and cloves. Is it possible that these all have something in common, which could contribute to their associations with the smells and tastes of Christmas? Shown in Figure 1 is a stacked plot of 1H spectra of these four spices (a) along with the 1H spectrum of pure eugenol (b). As you can tell, all these spices have a common singlet at 3.88 ppm, which represents the significant eugenol content in all these spices.

Figure 1. a) 1H (60 MHz) stacked spectra of nutmeg, ginger, allspice, and cloves in chloroform-d (CDCl3) with the region of interest highlighted in red. b) 1H (60 MHz) spectrum of eugenol and its chemical structure with the protons of interest highlighted in red.
So, as any normal chemist would do during the holidays, I tried my hand at testing out the recent application note I published on a real life application, which deals with quantitative NMR (qNMR) and uses the residual CHCl3 peak from chloroform-d as an internal calibrant. For this experiment, I extracted as much eugenol as I could from the spices using multiple chloroform washes and concentrating those washes down in vacuo. I then weighed and dissolved the product in a known mass and predetermined concentration (in this case, 97.9% CDCl3) of chloroform-d (refer to the application note for details on how this was done!).
Figure 2 shows one spectrum of the triplicates acquired for each spice to determine the eugenol content (wt%) in each sample via the residual chloroform peak. The results of these analyses are summarized in Table 1.
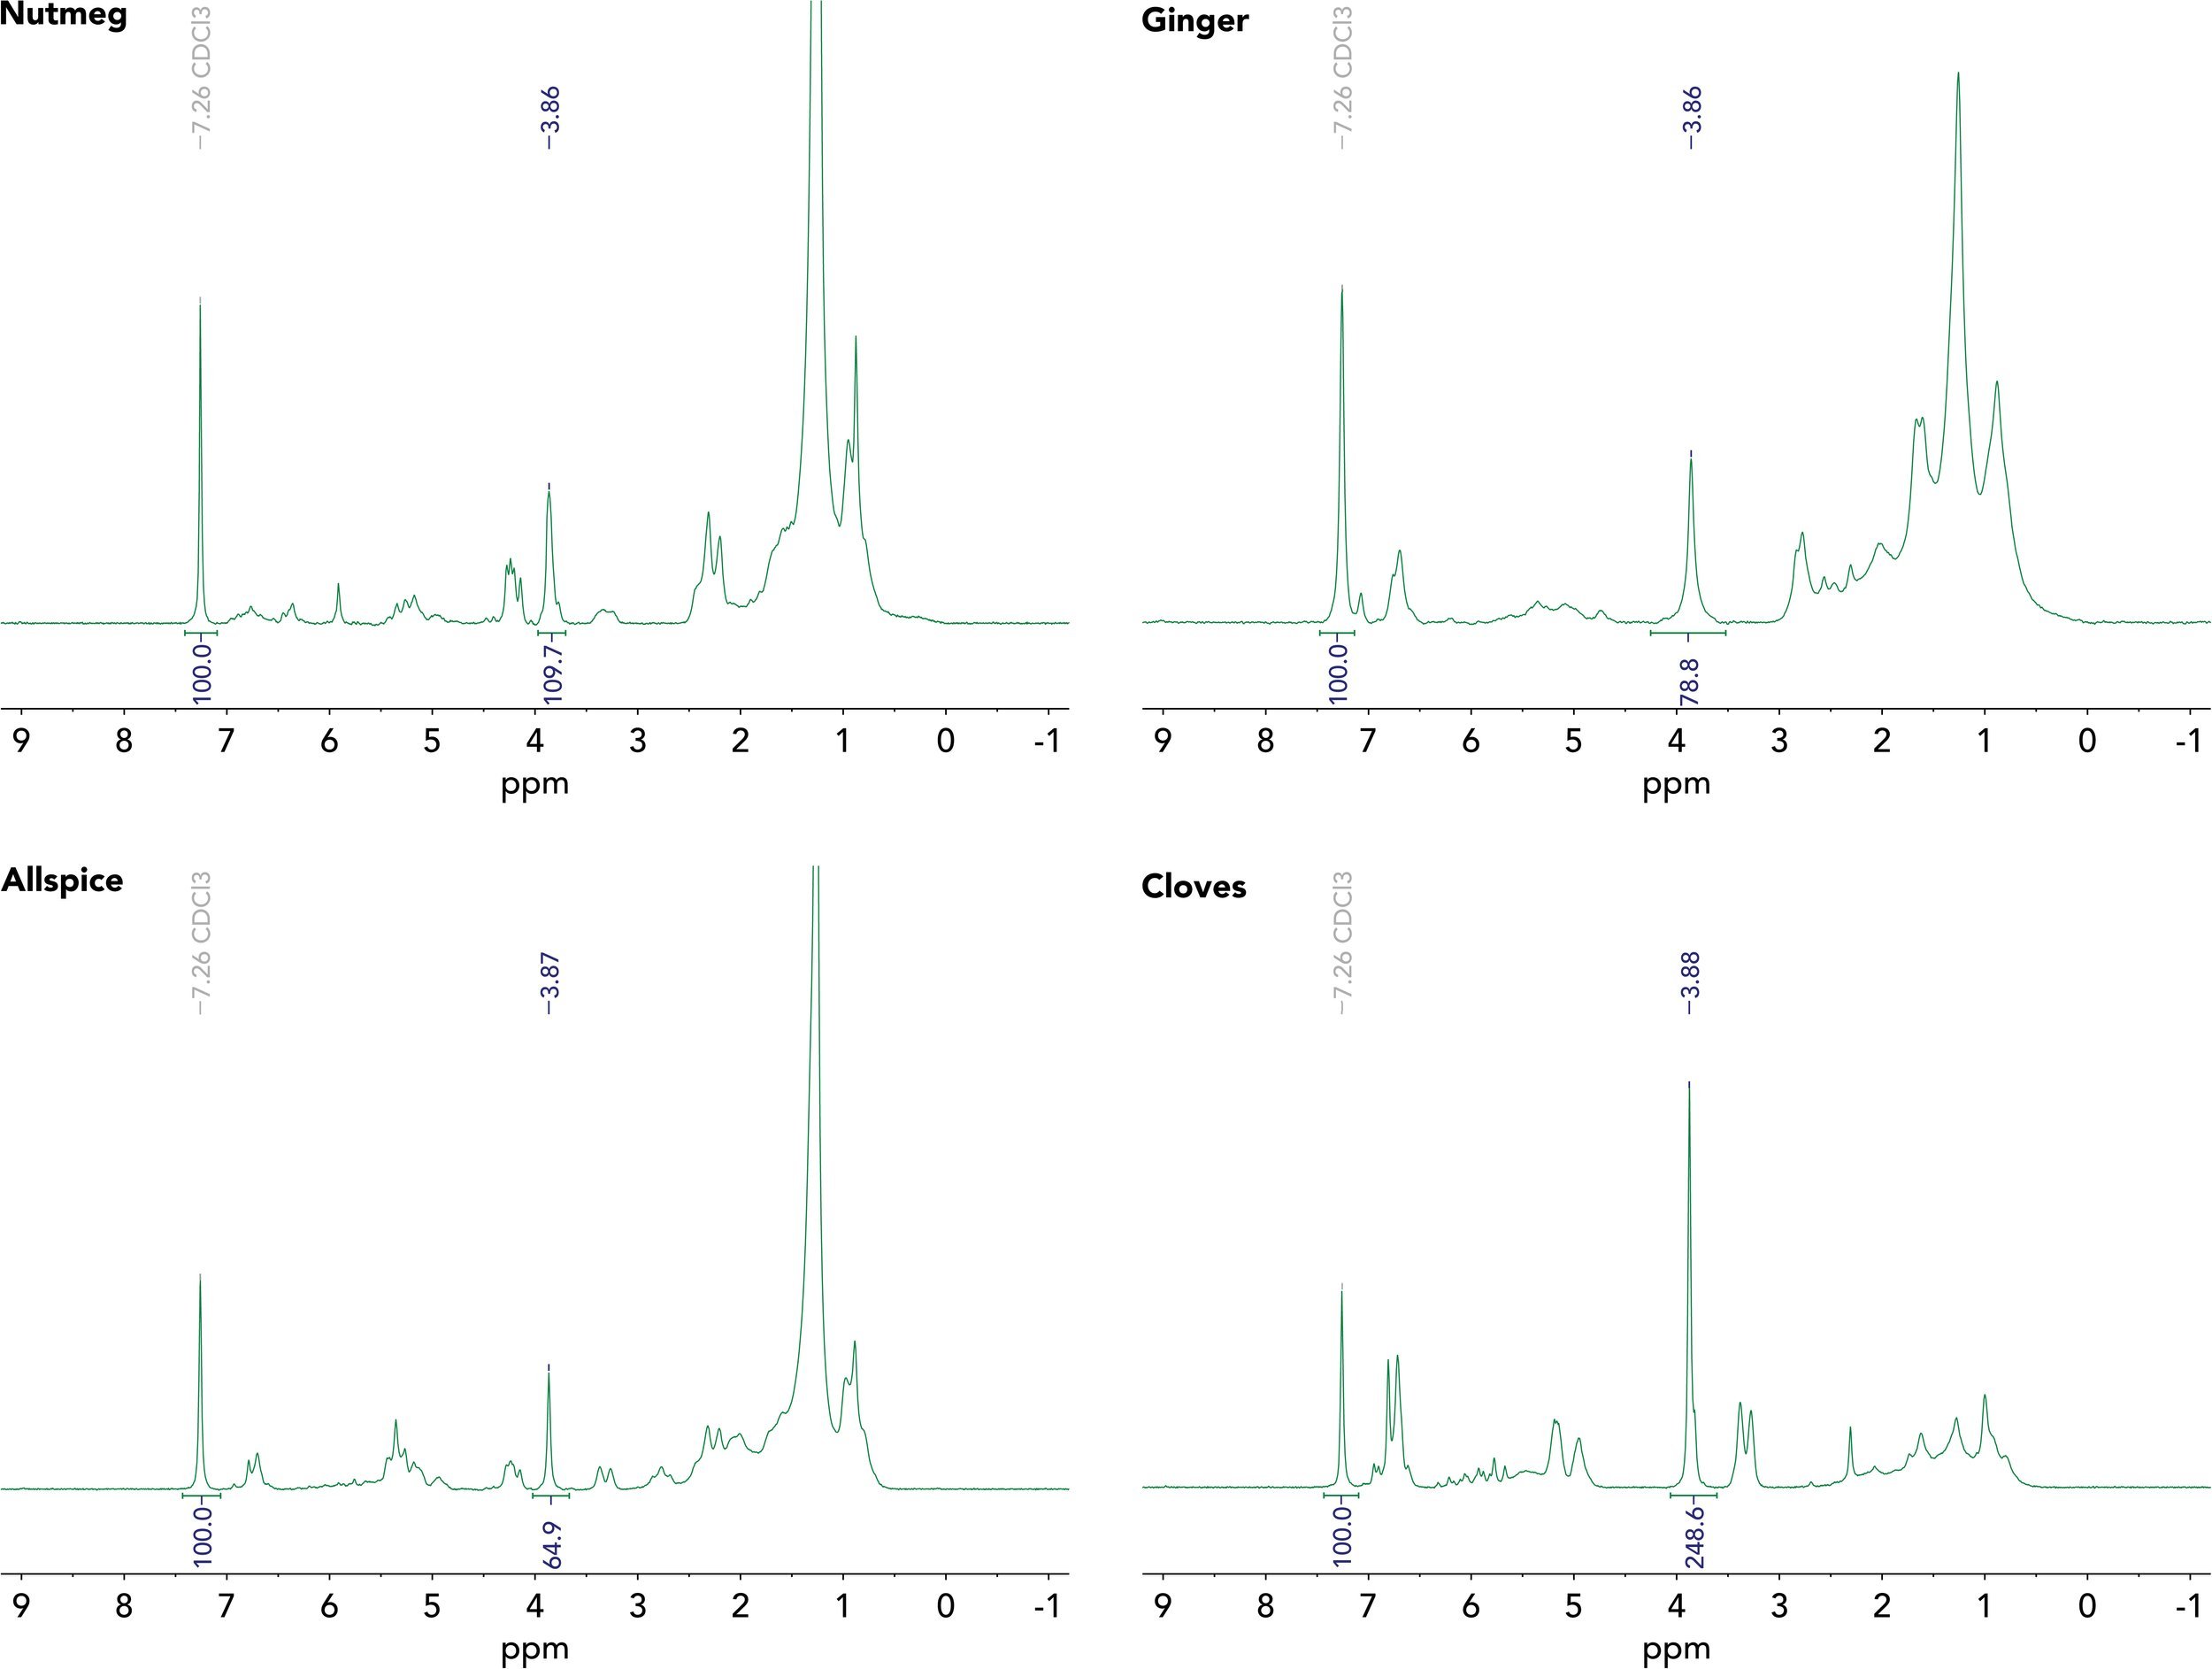
Figure 2. 1H NMR (60 MHz) spectra used for percent eugenol determination in nutmeg, ginger, allspice, and cloves using the residual chloroform signal as an internal calibrant.
Table 1. Determination of spice purity using the residual chloroform signal in CDCl3 as an internal calibrant.

As summarized in Table 1, cloves seem to have the largest eugenol content out of these four spices, with a eugenol content of 44.2 wt% (explaining why it smells exactly like eugenol). This is unsurprising because extraction of cloves is one of the main sources of eugenol. This equates to 21.10 mg of eugenol in the initial mass of the chloroform extract I used (48.76 mg). Allspice ended up with the lowest eugenol content at 7.4 wt% (5.71 mg), whereas nutmeg and ginger had a relatively similar amount of eugenol in them at 16.9 wt% (9.18 mg) and 18.8 wt% (6.57 mg), respectively.
It should be noted that these calculations are estimates of the eugenol content as we did not determine the extraction efficiency. However, since the Christmas holidays are coming up, I hope that you will all give me a break! Enjoy the aromatic baked goods and happy holidays everyone! I’ll talk to you all next year!